Integration
Description
This node calculates the integral of the probability density of a state $\psi$ written as $\int_a^b |\psi|^2 dx$ .
Inputs
The node has the following inputs:
- Integration limits ($a$ and $b$):Two scalars that define the spatial dimension to integrate over, where $a$ is the lower bound and $b$ is the upper bound
- State ($\psi$): The state whose probability density is integrated over.
Content
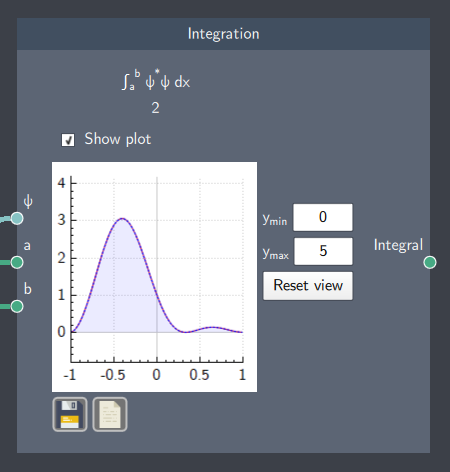
The node shows the value of the integral. It also shows a plot visualizing the integral by enabling the "Show plot" checkbox. The $y$-axis bounds of the plot can be adjusted in the $y_{min}$ and $y_{max}$ boxes.
Output
- Integral: The resulting integral after the integration of the probability density of the state. It also outputs a visualization of the integration on a plot by enabling the ''Show Plot'' check-box.
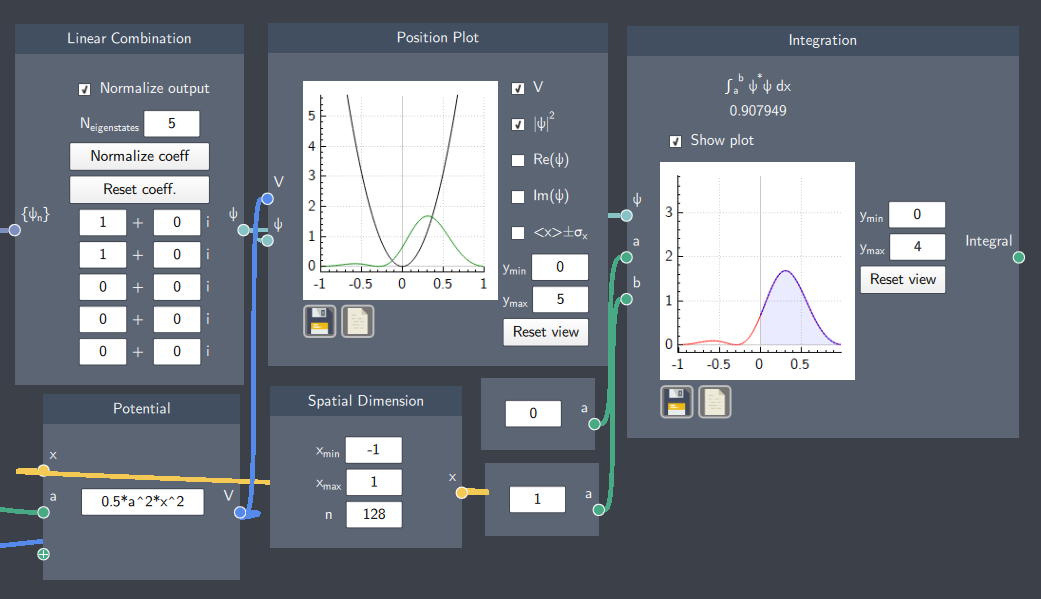
Example
In the example below, the integral over the probability density of a linear superposition state of a harmonic oscillator potential is calculated. The harmonic oscillator system is defined within -1 to 1 along the $x$-axis and the integration of the probability density is calculated over 0 to 1. This is denoted by the purple shaded area which is within the limits of integration while the red outline indicates that some part of the probability density is outside the integrated area.