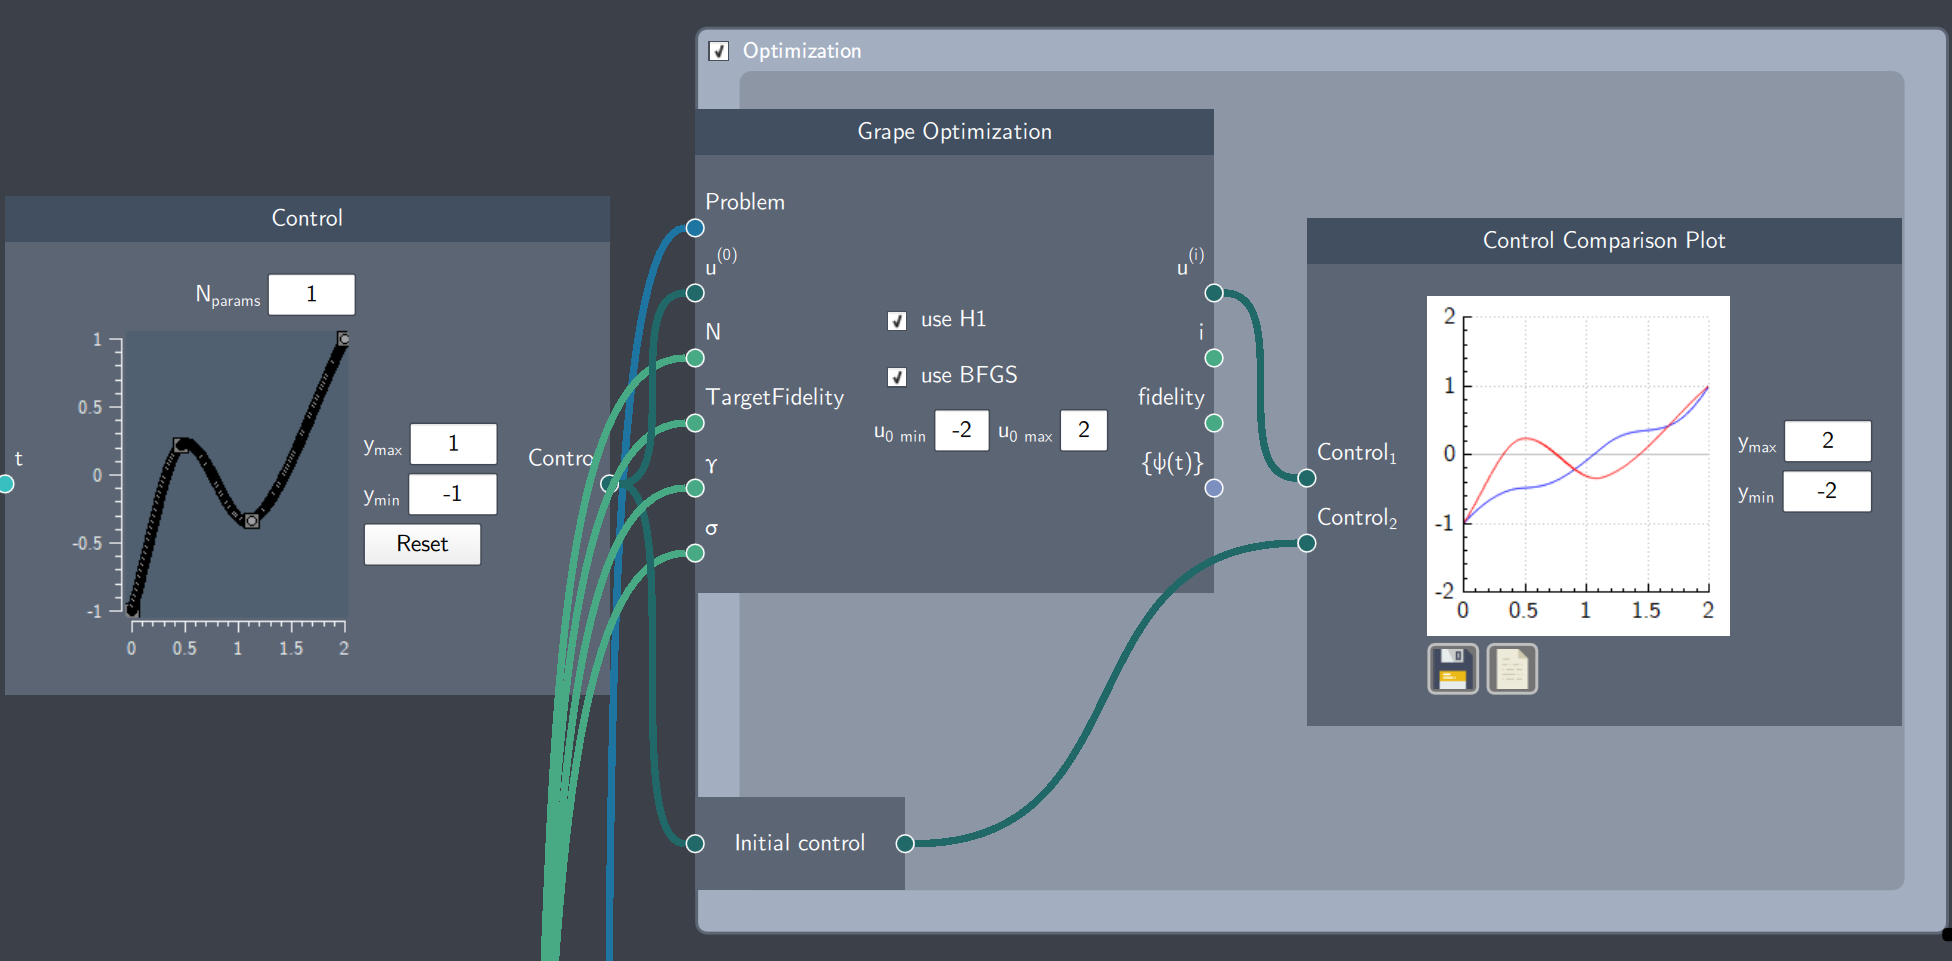
Control Comparison Plot
Description
The Control Comparison Plot node plots any two control trajectories for comparison, such as an initial control trajectory and the final control trajectory after optimization.
This node is particularly relevant for quantum optimal control problems.
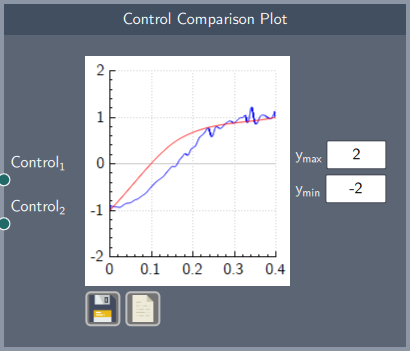
Input
The node has the following inputs:
- Control${}_1$ and Control${}_2$: Any two control trajectories
Content
The node plots two control trajectories. The limits of the $y$-axis can be specified in the $y_{max}$ and $y_{min}$ fields.
Example
In the example below, an intial trajectory is optimized by an optimization algorithm (GRAPE) and the initial (red curve) and optimized trajectories (blue) are plotted on the Control Comparison Plot.