
Plots
The Plot category consists of 6 nodes that correspond to visualizing potential functions, wave functions, control trajectories, energy spectrum and their evolution over time. The nodes plot one-dimensional functions in the Cartesian coordinate system.
All the displayed plots can be saved as an image and plot data can be exported as a .csv file by clicking on the following icons:
![]()
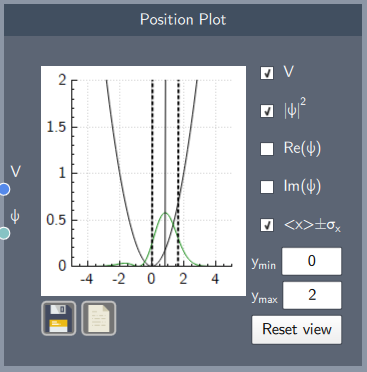
Visualize:
- Potential function
- Probability density
- Real and Imaginary parts of a wave function
- Expectation value of position ($ \langle x \rangle $) and its standard deviation
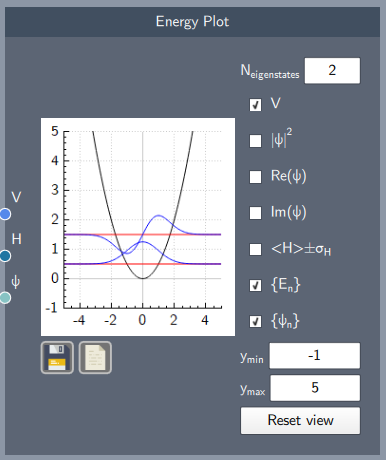
Visualize:
- Eigenstates and eigenvalues
- Probability density
- Real and imaginary parts of a wavefunction
- Expectation value of the Hamiltonian ($\langle H \rangle $) and its standard deviation
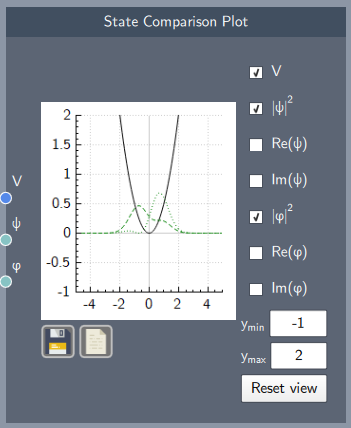
Plot any two states for comparison, such as an initial state and its final state after time evolution
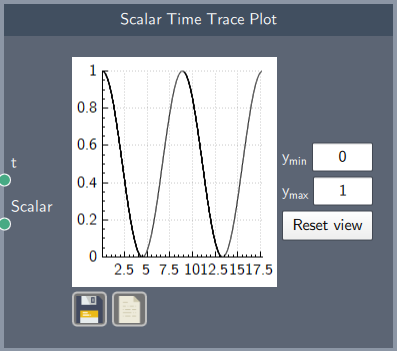
Plot a scalar quantity developing over time
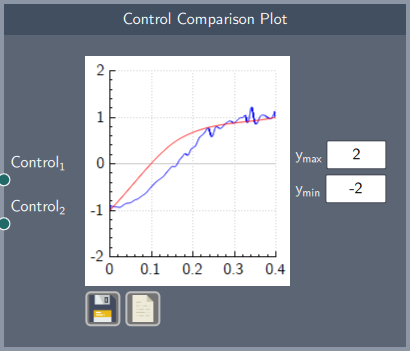
Plot any two control trajectories for comparison, such as an initial control trajectory and the final control trajectory after optimization
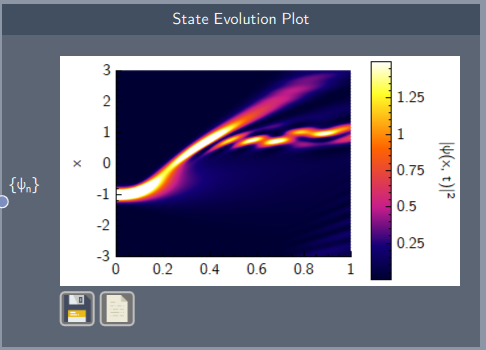
Visualize the evolution of the probability density of a state over space and time