GPE Energy Plot
Description
The GPE Energy Plot node plots the eigenstates and eigenvalues, potential function, probability density, real and imaginary parts of the wave function, and the expectation value of the Hamiltonian (with its standard deviation) for a system modeled by GPE physics.
Inputs
The node has the following inputs:
- Potential (V): A potential function defined in the Potential node
- GPE Hamiltonian ($H_{GPE}$): The GPE Hamiltonian node
- Wave Function ($\psi$): Any analytically defined or linearly-combined wave function
- Eigenstates ($\psi_{n}$): The eigenstates from the GPE Spectrum node
- Eigenvalues ($E_{n}$): The eigenvalues from the GPE Spectrum node
Content
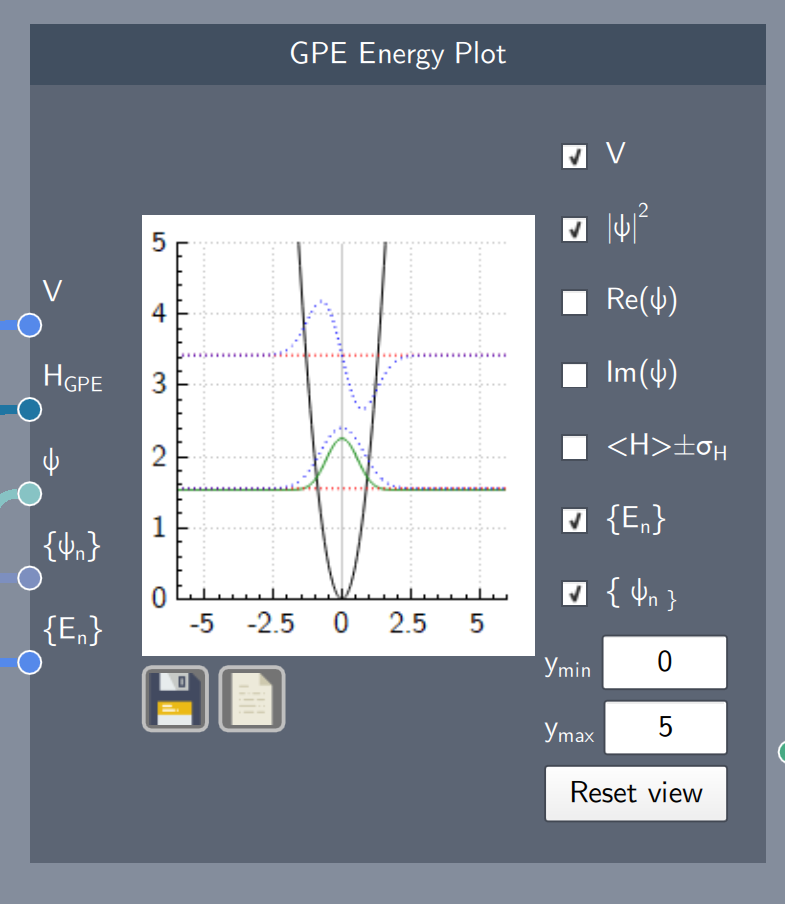
This plot consists of check-boxes corresponding to different functions. These checkboxes can be selected to visualize the various functions.
The different check-boxes/functions from top to bottom (with required inputs in parenthesis) are:
- Show/Hide the potential (V)
- Show/Hide the probability distribution of the state ($\psi$)
- Show/Hide the real part of the state ($\psi$)
- Show/Hide the imaginary part of the state ($\psi$)
- Show/Hide the expectation value of the Hamiltonian +/- the standard deviation (H)
- Show/Hide the eigenvalues (H,$\psi_{n}$)
- Show/Hide the eigenstates (H, $E_{n}$)
Additionally, the $y$-axis limits can be set to any limits and reset to the original scale. The plot can be saved and the data can be exported as a .$csv$ file.
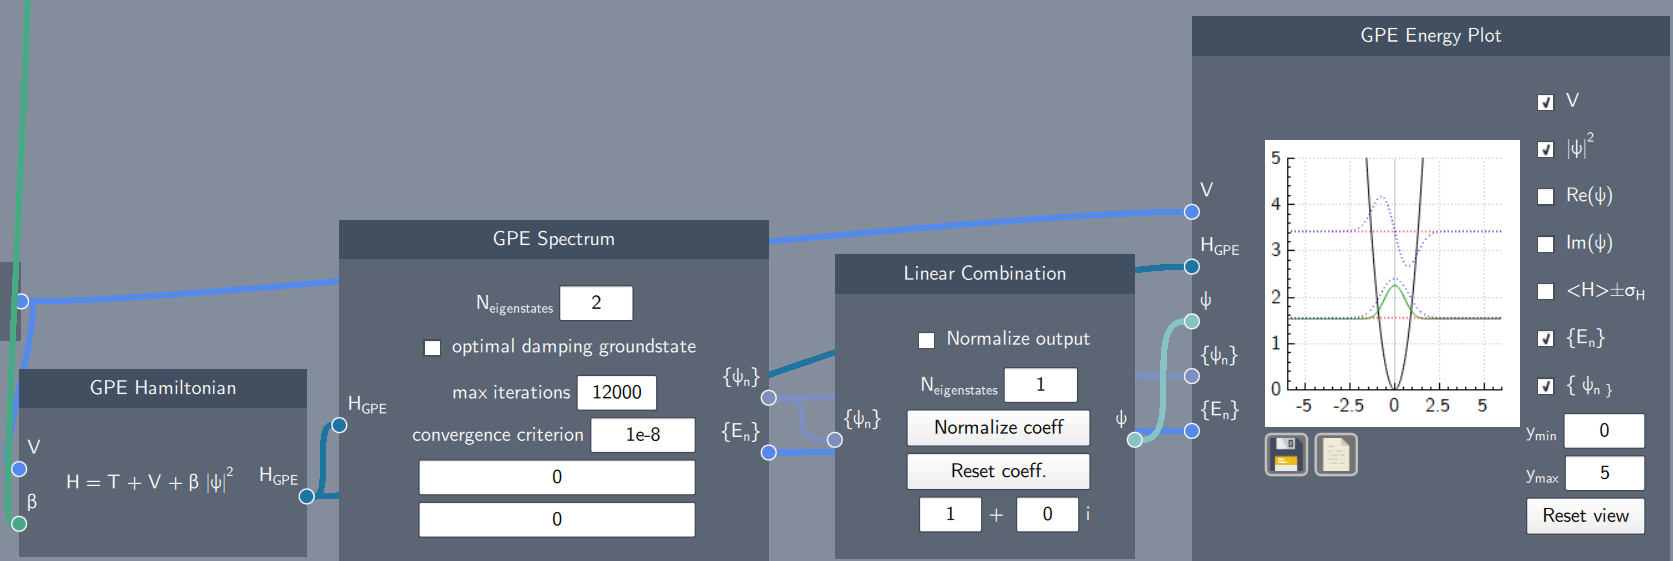
Example
In the example below, the energy spectrum of a system defined by the GPE Hamiltonian is plotted on the GPE Energy Plot. The eigenstates (blue dotted-curves), eigenvalues (red dotted-lines) and the probability density (green curve) are plotted along with the potential function (black curve).